Use CloudTally
Investigate why spend changed
Use Cost Explorer to compare spend, find the largest cost drivers, inspect resource timelines, and account for Hetzner billing caps and monthly limits.
Last updated: 2026-10-15
On this page
When cloud spend shifts unexpectedly, you need to answer two questions: which resources changed, and what caused the cost movement. CloudTally's Cost Explorer separates those questions into two dedicated analysis views: Why spend changed isolates the period-over-period delta, while Cost breakdown and the resource Inspect drawer uncover the underlying operational events.
This guide explains how to bound a cost shift in time, navigate period comparisons, drill into resource lifecycle events, and account for Hetzner billing mechanics such as monthly caps and legacy price adjustments.
CloudTally provides read-only visibility into your infrastructure. Operational actions such as resizing, stopping, or deleting resources must be performed directly in your Hetzner Cloud Console.
Prerequisites
Before investigating spend shifts in Cost Explorer, ensure that:
- You have an active CloudTally account with access to your organisation.
- At least one Hetzner project is connected with completed initial sync (Connect your Hetzner project).
- Your project connections are updating normally (Manage Hetzner projects and data sync).
Step 1: Open Explorer and set the query window
Select Explorer from the main navigation. Choose a date range in the filter bar above the view tabs to isolate when the shift occurred:
- Choose a date preset:
- Last 7 days: Best for recent budget alerts, unexpected daily increases, or recent deployments.
- Last 30 days: Useful for spotting mid-month shifts or week-over-week trends.
- This month: Reconciles your current trajectory against monthly billing cycles.
- Custom range: Sets exact boundaries around a deployment or incident window.
- Choose a granularity (Auto, Daily, Weekly, or Monthly). For spike investigations, keep Auto or choose Daily.
- Narrow the scope with the filter buttons if needed:
- Resource Type: Focus on servers, volumes, load balancers, or floating IPs.
- Projects: Isolate a single connected Hetzner project.
- Location: Filter by Hetzner region.
- Labels: Select a cluster, environment or another label value.
These filters apply to every view. The scope summary below them shows spend for the range, current run rate, the current month's forecast and savings candidates. For the time frames and label comparisons, read See what a label group costs.
Check the header’s VAT chip before comparing amounts. See Display currency and VAT. This page-level display choice is separate from a budget’s saved VAT choice.
Step 2: Analyse period deltas with Why spend changed
Switch to the Why spend changed view below the scope summary.
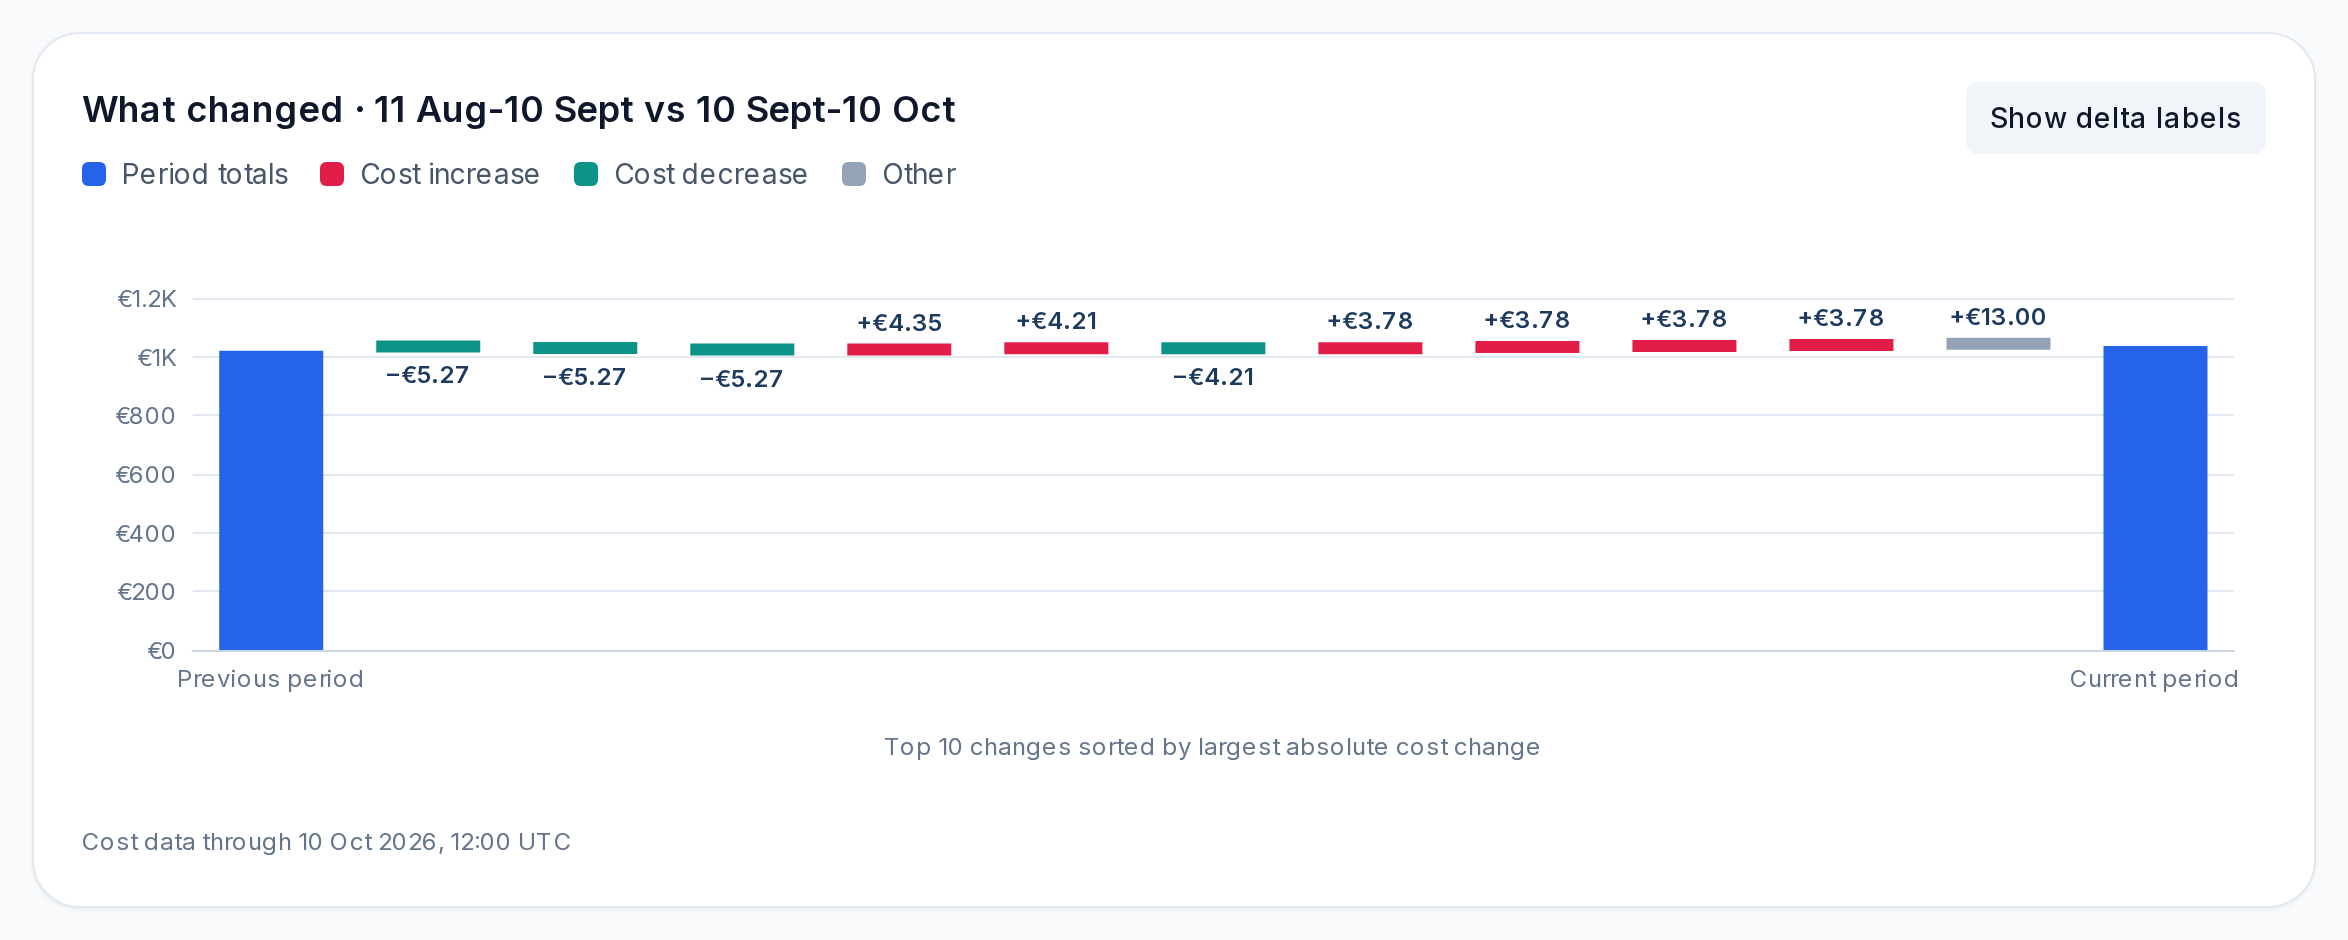
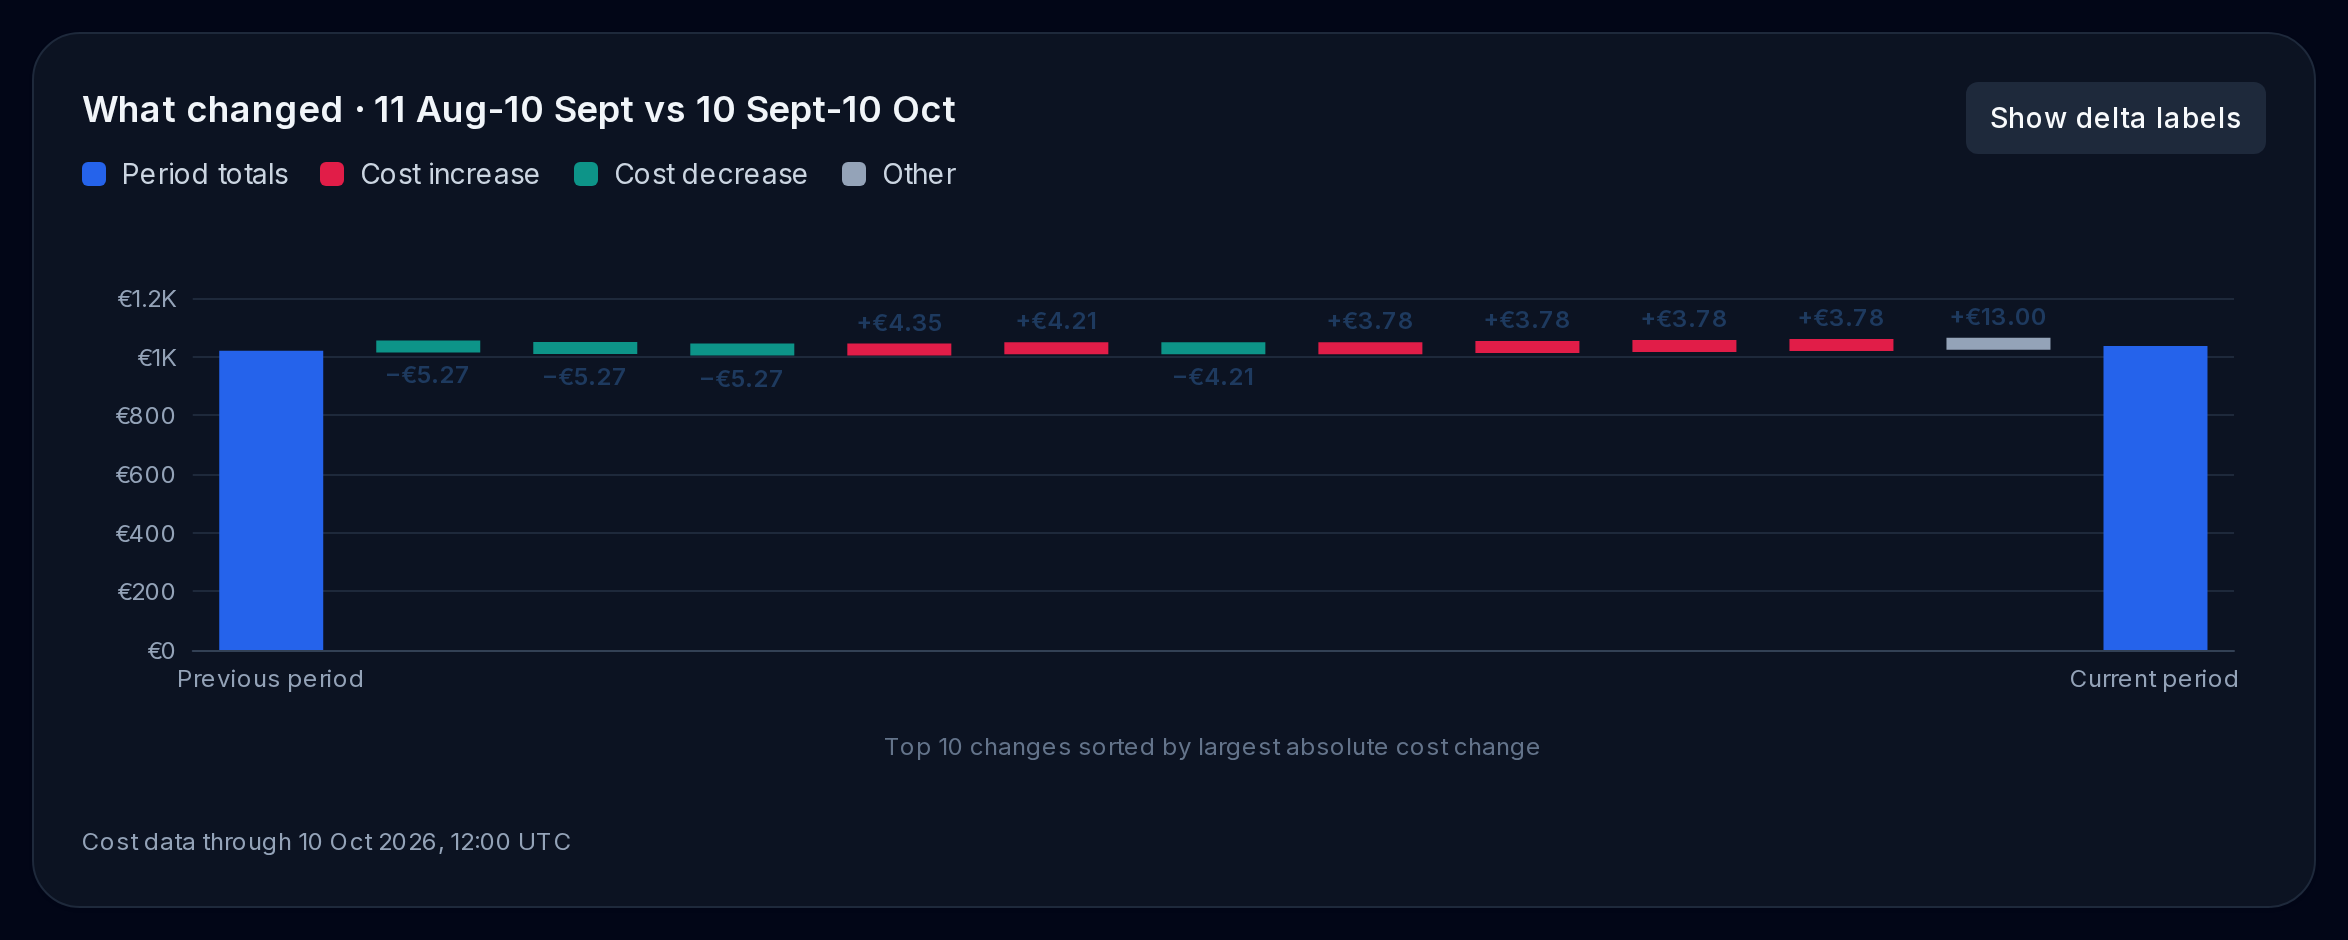
This view renders a waterfall chart comparing your selected window against the prior period of equal duration. Bars are sorted by largest absolute cost change:
- Period totals: The opening and closing bars represent the total baseline spend for the prior period and current period.
- Cost increase: Upward bars (displayed in rose) mark resources that added spend relative to the prior period.
- Cost decrease: Downward bars (displayed in teal) mark resources where spend dropped.
- Toggle Show delta labels to display the exact currency difference on each bar.
Cost movements shown in the waterfall highlight where spend shifted, but a delta alone is not proof of the operational cause. For example:
- A prominent cost increase bar could indicate that a new server was provisioned, an existing server was rescaled, or a resource ran for more billable hours than in the previous period.
- A cost decrease bar alongside an increase might reflect an environment migration or tier replacement, but the underlying events must be verified.
- Always use the resource events in the inspect drawer to confirm the actual operational trigger.
Step 3: Identify cost concentration with Cost breakdown
Switch to Cost breakdown to compare costs across your estate and see where the spend is concentrated.
- Open the Group by dropdown to aggregate costs by dimension:
- Project: Identifies which connected Hetzner project accounts for the most spend.
- Resource type: Shows how spend is distributed across compute, storage, or networking.
- Location: Highlights regional cost differences.
- A key under Label keys: Compares label values, such as environments or clusters.
- Resource: Ranks individual resources by spend, identifying the exact server, volume, or load balancer driving your bill.
- Check the drivers table below the chart for each item's Period cost, previous baseline, net change, and share of total spend.
- Read the table groups:
- When grouped by Project, Resource type, Location or a label key, the table rows represent aggregate groups and deliberately omit the inspect control.
- Click into a group row to drill down into its constituent resources.
- Once individual resource rows are displayed, or when grouping directly by Resource, the table exposes the Inspect action.
Step 4: Inspect resource history and lifecycle events
In the drivers table, click Inspect on any resource row to open the inspect drawer.
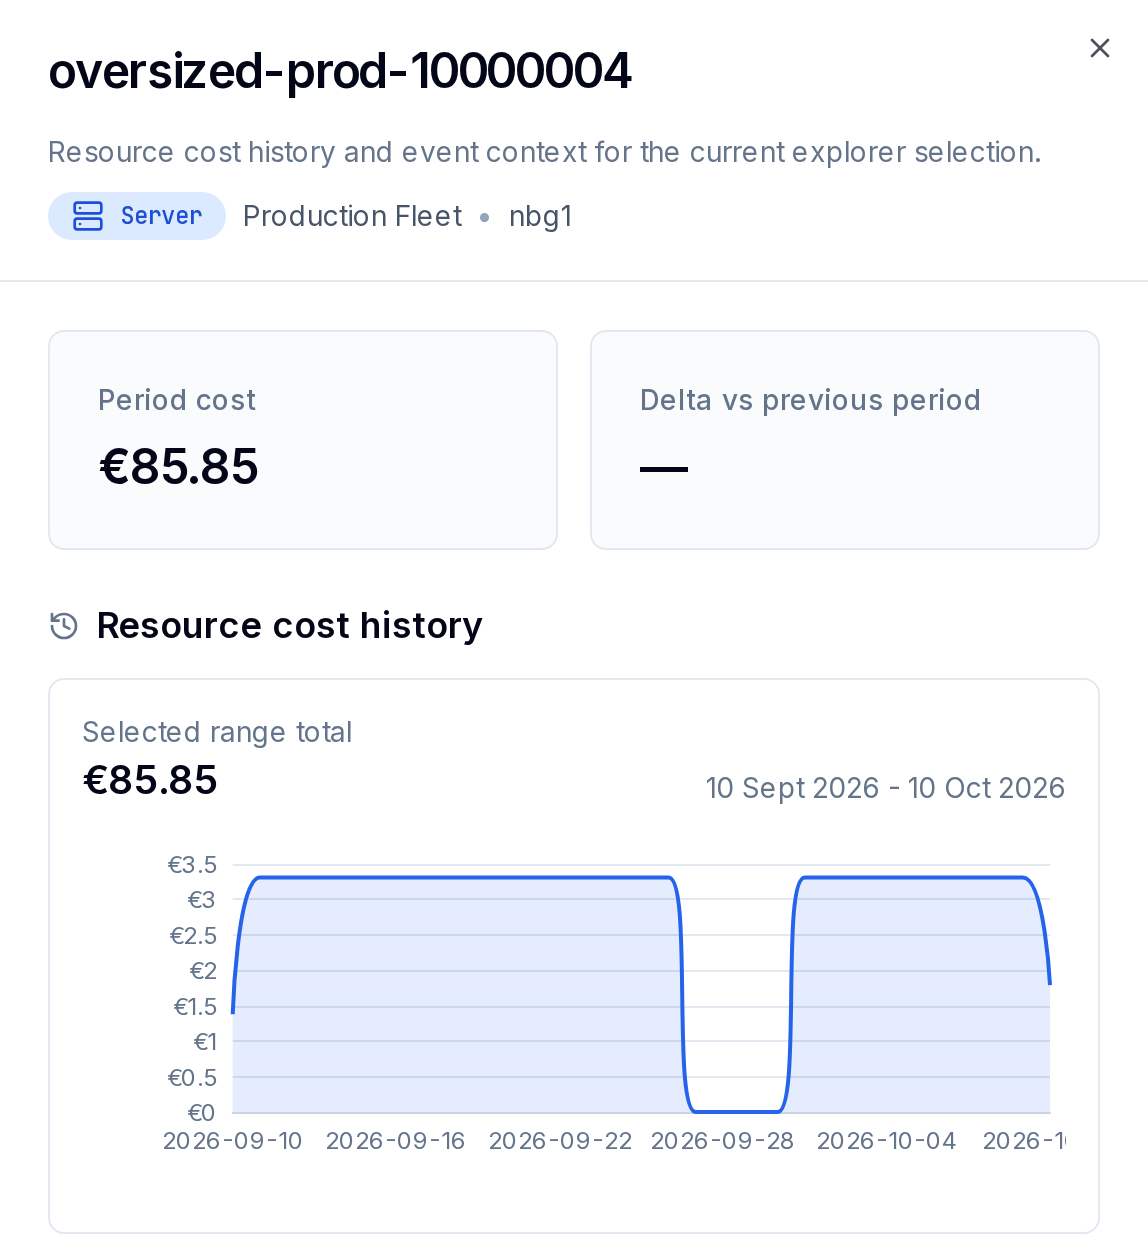
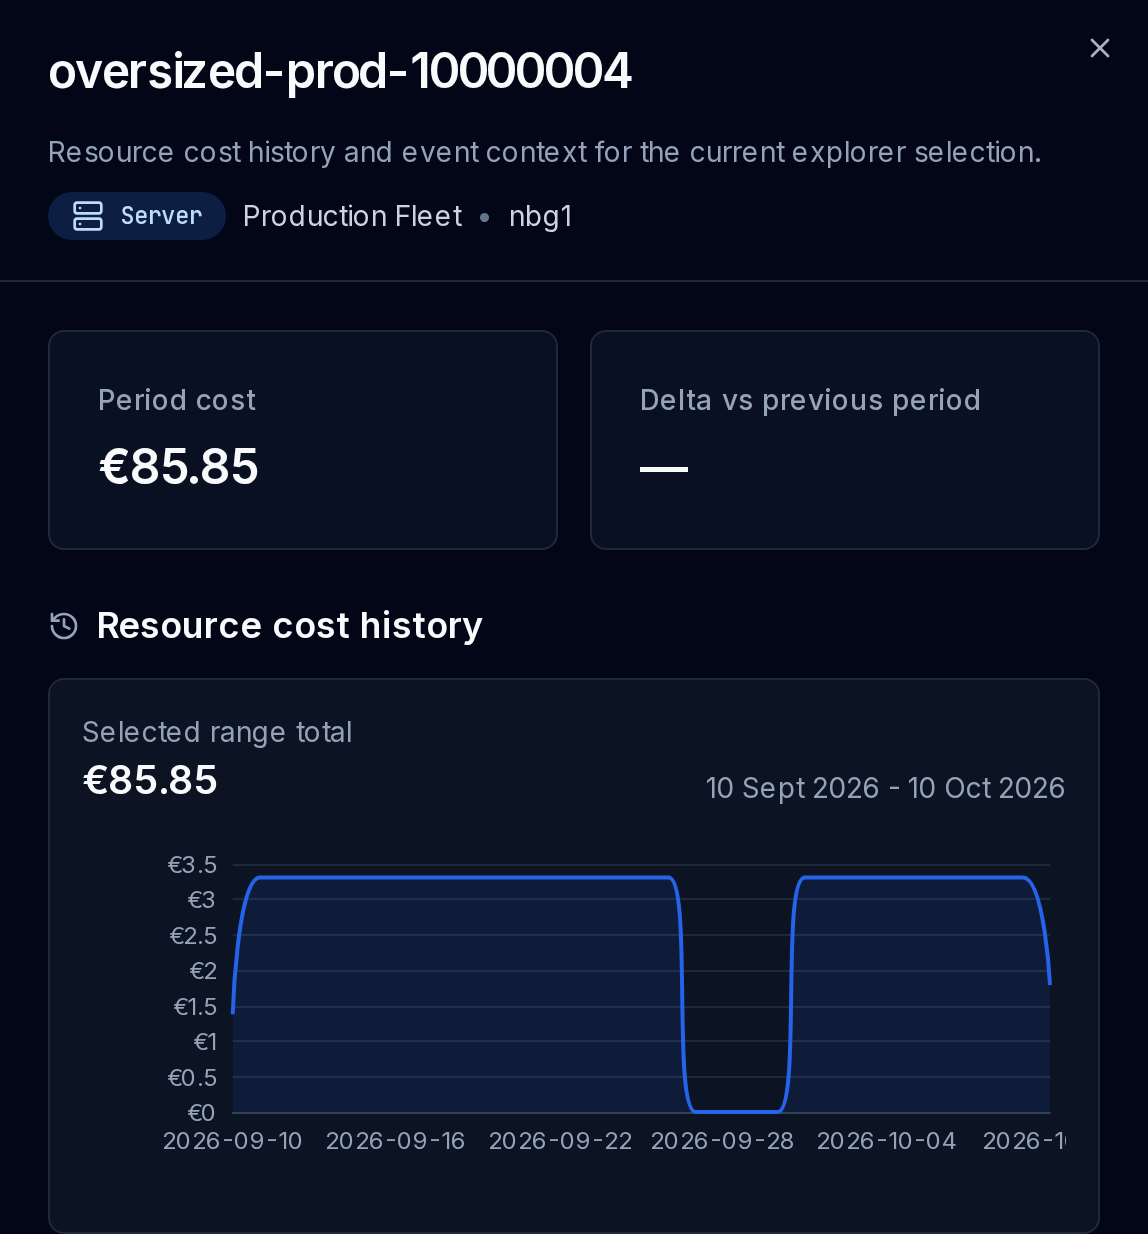
The drawer provides:
- Summary header: Shows the resource name, category, project, location, Period cost, and Delta vs previous period.
- Resource cost history: A daily spend timeline across the queried range showing when spend shifted.
- Resource events: A chronological stream of infrastructure events detected during sync:
- Resource created: When the resource was provisioned.
- Rescaled: Server type changes (
from -> to). - Resized: Volume capacity adjustments (
from GB -> to GB). - Price changed: Rate adjustments applied to the resource.
- Resource deleted: When the resource was decommissioned in Hetzner.
If Delta vs previous period displays a dash, the comparison is unavailable; it is not a zero change. If Resource events says No events in this range., the empty list does not establish what caused a spend change.
Correlating the cost timeline against these verified lifecycle events helps you determine whether a spike resulted from configuration changes, newly provisioned infrastructure, or elapsed operational hours.
Hetzner billing dynamics in Cost Explorer
When evaluating Hetzner infrastructure costs, keep these provider-specific rules in mind:
Monthly billing caps
Under Hetzner's pricing model, cloud resources are billed at an hourly rate up to a predetermined monthly price cap. Mathematically, Hetzner bills the lower of accumulated hourly usage or the monthly cap, as outlined in the official Hetzner Cloud billing FAQ.
When a long-running server reaches its monthly cap:
- Incremental hourly charges flatten to zero for the remainder of that calendar month.
- The server remains fully operational and shows an Active status in CloudTally.
- On the 1st of the next calendar month, the billing accumulator resets and hourly charges resume.
This dynamic can cause spend on long-running servers to flatten late in the month and step up on the 1st. To distinguish a billing cap from a deletion, check the inspect drawer: if cost has flattened but the status is Active without a Resource deleted event, the monthly cap is in effect.
The 15 June 2026 price adjustment
Hetzner adjusted base pricing for cloud and dedicated servers on 15 June 2026 at 08:00 CEST. As detailed in the official Hetzner price adjustment documentation:
- New orders and server rescales performed at or after the 15 June 2026 price change use updated pricing.
- Eligible existing cloud servers created before the price change retain their grandfathered legacy prices until a price-changing action occurs.
- Rescaling an older server permanently migrates it to the current pricing schedule, recorded as a Price changed event in the inspect drawer.
Powered-off servers continue to incur charges
In Hetzner Cloud, powering off a server halts operating system execution but does not stop billing. Allocated CPU cores, memory, reserved local storage, and assigned IP addresses remain dedicated to your account. To stop charges, the server must be deleted in the Hetzner Cloud Console.
Plan differences
- Free plan: Includes full access to Why spend changed, Cost breakdown, custom date ranges, and the resource Inspect drawer.
- Pro plan: Adds smart forecasting models and contextual trend event markers on time-series charts.
Troubleshooting
The selected range starts before available history
Check the Overview total for a data since date. For example, a range from 1 Apr to 1 Jun 2026 can show Total cost, data since 20 Apr, with chart and table data beginning on 20 Apr. The selected dates can extend beyond the history available for that query.
Check the resource drawer’s comparison separately. An unavailable delta shown as a dash does not mean there was no spend in the previous period.
No cost changes visible in Why spend changed
- Identical periods: If infrastructure was unchanged across both comparison windows, a notice indicates costs were identical.
- Aggregated projects: Increases in one project can offset decreases in another. Filter by project to isolate changes.
- Stale connection warning: If a connection fails to sync, an alert banner indicates cached data. Check connection status in Manage Hetzner projects and data sync.
Related guides
- Understand your dashboard. Monitor spend trends and projections.
- Create and manage budgets. Set spending limits and alerts.
- Configure alerts and notifications. Route alert notifications to email or Slack.